The WebIDE Monitor is a general-purpose data tool designed to help you track the performance of Firefox OS apps and devices.
The Monitor is able to display live, interactive graphs to visualize time series.
Available graphs
The Monitor comes with several different graphs. They usually show up once WebIDE is connected to a Firefox OS runtime.
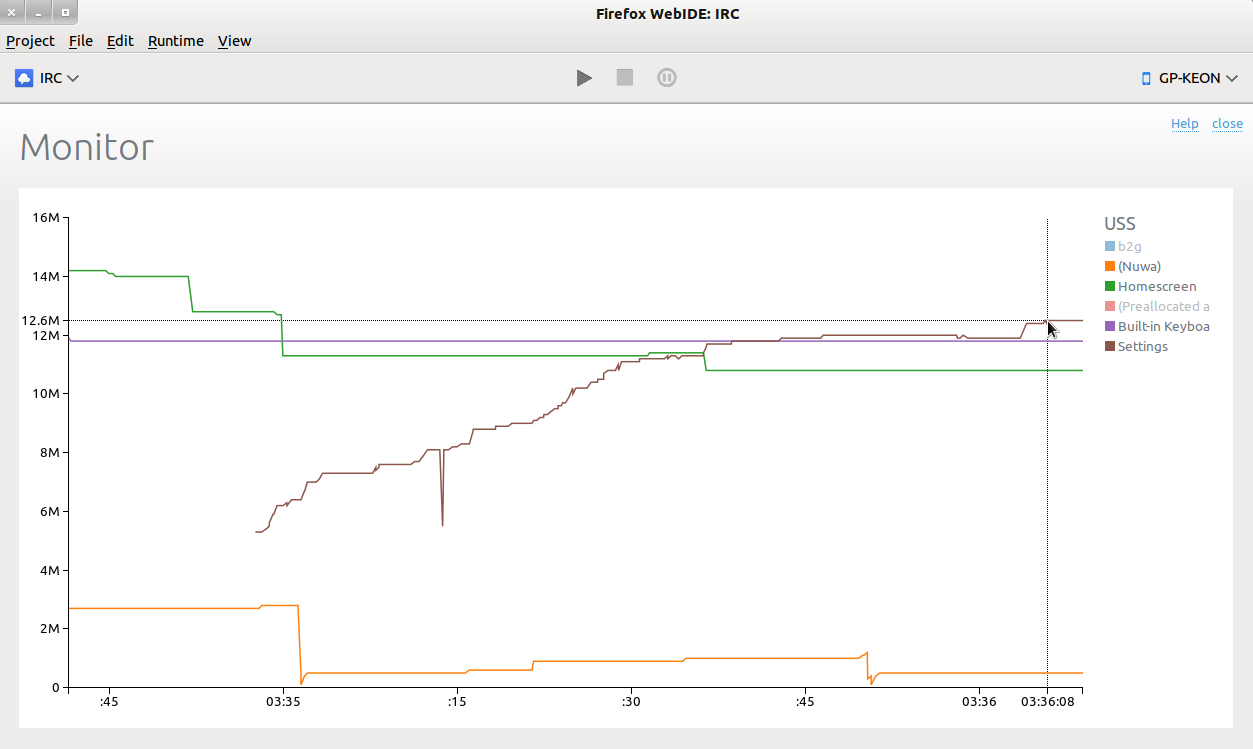
Unique Set Size
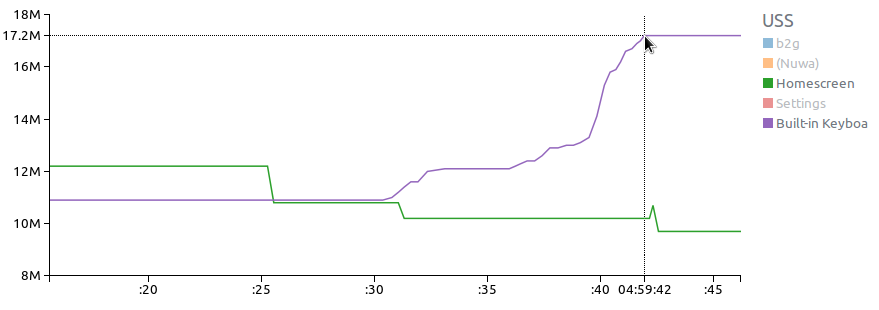
This graph shows the memory footprint of all Firefox OS processes over time. If you are interested in the memory consumption of a Firefox OS app, launch it, and the private memory used by its process will be displayed here.
Displaying your own data
It's relatively easy to display any kind of data in the Monitor, because it accepts loosely-formatted updates from many different sources.
From a Firefox OS device
You can send data from a connected device by sending observer notifications.
Note: If you would like to do this in a certified app, please follow these instructions.
Services.obs.notifyObservers(null, 'devtools-monitor-update', data);
You can send data from any JS code with chrome privileges. Here is a complete example measuring the run time of some JS code:
JavaScript
const Services = require('Services');

var start = Date.now();
// code to benchmark
var stop = Date.now();

var data = { graph: 'Performance', myFeature: stop-start, time: stop };
Services.obs.notifyObservers(null, 'devtools-monitor-update', JSON.stringify(data));
C++
observerService->NotifyObservers(nullptr, "devtools-monitor-update", data);
You can send data from anywhere in Gecko. Here is a complete example measuring the run time of some code:
#include <time.h>
#include "nsPrintfCString.h"
#include "nsIObserverService.h"

clock_t start = clock();
// code to benchmark
clock_t stop = clock();
double time = (double)(stop - start) / (CLOCKS_PER_SEC / 1000);

nsCOMPtr<nsIObserverService> observerService = services::GetObserverService();
if (observerService) {
  nsPrintfCString str("{\"graph\":\"Performance\",\"myFeature\":%f}", time);
  nsAutoString data = NS_ConvertUTF8toUTF16(str);
  observerService->NotifyObservers(nullptr, "devtools-monitor-update", data.get());
}
From your computer
You can easily send data to the Monitor over a WebSockets server. This can be useful if you're writing a Firefox extension, a command-line tool or a web service.
By default, the Monitor looks for a server running on the port 9000 of you computer. You can change this by updating the devtools.webide.monitorWebSocketURL preference.
You can even make it accept data from your local network, or from anywhere on the Internet.
Node.js
TODO
Python
TODO
Supported formats
The Monitor accepts data in the form of JSON objects that generally look like this:
{
  "graph": "myGraph",
  "curve": "myCurve",
  "value": 42,
  "time": 1234567890
}
That format is meant to be very flexible. If a specified graph or curve doesn't exist, it will be created automatically.
Arbitrary names
Unrecognized entries will be considered as curve name and value.
The smallest data packet you can send is something like:
{ "myCurve": 42 }
This will add a data point to "myCurve" in a graph with no name. The missing time will default to when the Monitor received the packet.
For better precision, it's probably better to always specify a timestamp for your data:
{
  "current": 60,
  "voltage": 500,
  "time": 1234567890
}
Multiple values
In a single update, you can send data for multiple curves:
{
  "graph": "myGraph",
  "myCurve1": 50,
  "myCurve2": 300,
  "myCurve3": 9000,
  "time": 1234567890
}
Or several data points for a single curve:
{
  "graph": "myGraph",
  "curve": "myCurve",
  "values": [
    { "time": 1234567890, "value": 42 },
    { "time": 1234567981, "value": 51 }
  ]
}
Multiple updates
And you can also send multiple data updates as an Array:
[
  { "graph": "Memory", "time": 1234567890, "System": 2600, "My App": 1000 },
  { "graph": "Power", "time": 1234567890, "current": 60, "voltage": 500 }
]
Punctual events
To mark special events in a graph with a vertical bar, add an event key to your update:
{
  "graph": "myGraph",
  "event": "myEvent",
  "time": 1234567980
}