Found 154 pages:
| # | Page | Tags and summary |
|---|---|---|
| 1 | Firefox Developer Tools | Developing Mozilla, Guide, Tools, Web Development, Web Development:Tools, l10n:priority |
| Examine, edit, and debug HTML, CSS, and JavaScript on the desktop and on mobile. | ||
| 2 | 3D view | HTML, Tools, Web Development, Web Development:Tools |
| When you click on the 3D view button, the page goes into 3D view mode; in this mode, you can see your page presented in a 3D view in which nested blocks of HTML are increasingly "tall," projecting outward from the bottom of the page. This view makes it easy to visualize the nesting of your content. | ||
| 3 | Add-ons | |
| Developer tools that are not built into Firefox, but ship as separate add-ons. | ||
| 4 | DOM Inspector | DOM, DOM:Tools, DOM_Inspector, Extensions, Extensions:Tools, Themes, Themes:Tools, Tools, Web Development, Web Development:Tools, XUL, XUL:Tools |
| The DOM Inspector (also known as DOMi) is a developer tool used to inspect, browse, and edit the Document Object Model of documents - usually web pages or XUL windows. The DOM hierarchy can be navigated using a two-paned window that allows a variety of different views on the document and all nodes within. | ||
| 5 | DOM Inspector FAQ | DOM_Inspector |
| The File menu contains approaches which will allow you to inspect a document. | ||
| 6 | DOM Inspector internals | Code, Source, Tools, internals, organisation, source |
There are three main facets to DOM Inspector. The one you are likely to be most familiar with is its inspector.xul-based primary UI. This is the two-pane inspector that appears when Ctrl+Shift+I (or Cmd+Shift+I) is pressed from one of the applications for which DOM Inspector has explicit support (i.e., menuitems placed via overlay). |
||
| 7 | Introduction to DOM Inspector | DOM_Inspector |
| The DOM Inspector is a Mozilla extension that you can access from the Tools > Web Development menu in SeaMonkey, or by selecting the DOM Inspector menu item from the Tools menu in Firefox and Thunderbird, or by using Ctrl/Cmd+Shift+I in either application. DOM Inspector is standalone; it supports all toolkit applications, and it's possible to embed it in your own XULRunner app. DOM Inspector can serve as a sanity check to verify the state of the DOM, or it can be used to manipulate the DOM by hand, if desired. | ||
| 8 | Adding a panel to the toolbox | |
| How to write an add-on that adds a new tool to the toolbox. | ||
| 9 | Browser Console | Browser, Debugging, Tools, Web Development, WebDevelopment:Tools, debugging |
| The Browser Console is like the Web Console, but applied to the whole browser rather than a single content tab. | ||
| 10 | Browser Toolbox | Debug, Firefox, JavaScript |
| The Browser Toolbox enables you to debug add-ons and the browser's own JavaScript code rather than just web pages like the normal Toolbox. The Browser Toolbox's context is the whole browser rather than just single page on a single tab. | ||
| 11 | CSS Coverage | |
| CSS Coverage is a set of commands for Firefox Developer tools that help untangle messy CSS by pointing out the CSS that isn't "used", and indicating the parts of your CSS files that are needed for initial rendering. | ||
| 12 | Contributing | |
| This is a guide to contributing to the Firefox Developer Tools. At a high level, the workflow for a contributor looks like this: | ||
| 13 | Contribute on Nightly | |
| This page describes a simple way of contributing to the Firefox Developer Tools that does not involve building Firefox or setting up any special environment. | ||
| 14 | DOM Property Viewer | DOM, Tools, Web Development |
The DOM Property Viewer lets you inspect the properties of the DOM as an expandable tree structure, starting from the window object of the current page or the selected iframe. |
||
| 15 | Debugger | Debugger, Debugging, Dev Tools, Firefox OS, Tools, debugging, l10n:priority |
| The JavaScript Debugger enables you to step through JavaScript code and examine or modify its state to help track down bugs. | ||
| 16 | How to | |
| These articles describe how to use the debugger. | ||
| 17 | Access debugging in add-ons | |
| The following items are accessible in the context of chrome://browser/content/debugger.xul (or, in version 23 beta, chrome://browser/content/devtools/debugger.xul): | ||
| 18 | Black box a source | |
| In modern web development, we often rely on libraries like jQuery, Ember, or Angular, and 99% of the time we can safely assume that they “just work”. We don’t care about the internal implementation of these libraries: we treat them like a black box. However, a library’s abstraction leaks during debugging sessions when you are forced to step through its stack frames in order to reach your own code. With black boxing, you can tell the debugger to ignore the details of selected sources. | ||
| 19 | Break on a DOM event | |
| If you're listening to a particular DOM event, you can tell the debugger to break when the event is triggered without having to track down the listener and set a breakpoint manually. | ||
| 20 | Debug eval sources | |
You can debug JavaScript code that is evaluated dynamically, either as a string passed to eval() or as a string passed to the Function constructor. |
||
| 21 | Disable breakpoints | |
| To disable a breakpoint, uncheck the check box next to the breakpoint's entry in the Source list pane: | ||
| 22 | Examine, modify, and watch variables | |
| When the code has stopped at a breakpoint, you can examine its state in the variables pane of the debugger: | ||
| 23 | Highlight and inspect DOM nodes | |
| If you hover over a DOM node in the Variables pane, it will be highlighted in the page. | ||
| 24 | Open the debugger | |
To open the debugger press the menu button (  ), press "Developer", then select "Debugger". Or use the keyboard shortcut: ), press "Developer", then select "Debugger". Or use the keyboard shortcut: |
||
| 25 | Pretty-print a minified file | |
| To pretty-print a file that has been minified, open the minified file and click the icon that contains a pair of braces: | ||
| 26 | Search and filter | |
| To search for items inside the debugger, use the script filter in the toolbar: | ||
| 27 | Set a breakpoint | JavaScript, Tools |
| The following are different ways to set a breakpoint within the JavaScript code in the debugger. | ||
| 28 | Set a conditional breakpoint | |
| To set a conditional breakpoint, activate the context menu while on the line you want to break at in the source pane, and select "Add conditional breakpoint". Then enter the conditional expression in the popup that appears: | ||
| 29 | Step through code | |
| When your code stops at a breakpoint, you can step through it using the four buttons on the left of the toolbar: | ||
| 30 | Use a source map | |
| JavaScript sources are often combined and minified to make delivering them from the server more efficient. Increasingly, too, JavaScript running in a page is machine-generated, as when compiled from a language like CoffeeScript or TypeScript. By using source maps, the debugger can map the code being executed to the original source files, making debugging much, much easier. | ||
| 31 | Keyboard shortcuts | |
| 1. By default, on some Macs, the function key is remapped to use a special feature: for example, to change the screen brightness or the volume. See this guide to using these keys as standard function keys. To use a remapped key as a standard function key, hold the Function key down as well (so to open the Profiler, use Shift + Function + F5). | ||
| 32 | Settings | |
| The Debugger has its own settings menu, which you can access from an icon in the toolbar: | ||
| 33 | UI Tour | |
| This article is a quick tour of the main sections of the JavaScript Debugger's user interface. The UI is split into six main sections, which we'll cover one at a time: | ||
| 34 | Debugger-API | |
Mozilla’s JavaScript engine, SpiderMonkey, provides a debugging interface named Debugger which lets JavaScript code observe and manipulate the execution of other JavaScript code. Both Firefox’s built-in developer tools and the Firebug add-on use Debugger to implement their JavaScript debuggers. However, Debugger is quite general, and can be used to implement other kinds of tools like tracers, coverage analysis, patch-and-continue, and so on. |
||
| 35 | Debugger | |
When called as a constructor, the Debugger object creates a new Debugger instance. |
||
| 36 | Debugger.Environment | |
A Debugger.Environment instance represents a lexical environment, associating names with variables. Each Debugger.Frame instance representing a debuggee frame has an associated environment object describing the variables in scope in that frame; and each Debugger.Object instance representing a debuggee function has an environment object representing the environment the function has closed over. |
||
| 37 | Debugger.Frame | |
A Debugger.Frame instance represents a visible stack frame. Given a Debugger.Frame instance, you can find the script the frame is executing, walk the stack to older frames, find the lexical environment in which the execution is taking place, and so on. |
||
| 38 | Debugger.Object | |
A Debugger.Object instance represents an object in the debuggee, providing reflection-oriented methods to inspect and modify its referent. The referent’s properties do not appear directly as properties of the Debugger.Object instance; the debugger can access them only through methods like Debugger.Object.prototype.getOwnPropertyDescriptor and Debugger.Object.prototype.defineProperty, ensuring that the debugger will not inadvertently invoke the referent’s getters and setters. |
||
| 39 | Debugger.Script | |
A Debugger.Script instance may refer to a sequence of bytecode in the debuggee or to a block of WebAssembly code. For the former, it is the Debugger API’s presentation of a JSAPI JSScript object. The two cases are distinguished by their format property being "js" or "wasm". |
||
| 40 | Debugger.Source | |
A Debugger.Source instance represents either a piece of JavaScript source code or the serialized text of a block of WebAssembly code. The two cases are distinguished by the latter having its introductionType property always being "wasm" and the former having its introductionType property never being "wasm". |
||
| 41 | Tools/Debugger-API/Conventions | |
This page describes general conventions used in the Debugger API, and defines some terminology used throughout the specification. |
||
| 42 | Tools/Debugger-API/Debugger.Memory | |
The Debugger API can help tools observe the debuggee’s memory use in various ways: |
||
| 43 | Tools/Debugger-API/Tutorial-Debugger-Statement | |
This page shows how you can try out the Debugger API yourself using Firefox's Scratchpad. We use the API to evaluate an expression in the web page whenever it executes a JavaScript debugger; statement. |
||
| 44 | Tutorial: Show Allocations Per Call Path | Debugger, Tools, Tutorial |
This page shows how to use the Debugger API to show how many objects a web page allocates, sorted by the function call path that allocated them. |
||
| 45 | DevTools API | DevTools |
| The DevTools API provides a way to register and access developer tools in Firefox. | ||
| 46 | DevToolsColors | CSS |
| This chart lists colors and CSS variables as implemented in the dark theme and light theme for developer tools. | ||
| 47 | Developer Toolbar | Firefox, Tools, Web Development:Tools |
| The Developer Toolbar gives you command-line access to a number of developer tools from within Firefox. It is a Graphical Command Line Interpreter that provides integrated help for its commands and displays rich output with the power and conciseness of a command line. It is also extensible: you can add your own local commands and even convert them into add-ons so that other people can install them too. | ||
| 48 | Building GCLI For Firefox | Build instructions |
| Technical review completed. | ||
| 49 | Customization | |
The mozcmd format is a way to store GCLI commands for easy access. It is available to Firefox users by setting the devtools.commands.dir to point to a directory containing a number of files with the extension mozcmd. |
||
| 50 | Future | |
| This section is about future extensibility, it does not document current functionality. GCLI currently has 3 extension points: |
||
| 51 | Display security and privacy policies | Firefox, GCLI, Tools, Web Development:Tools |
The security command displays information about the security and privacy settings for a website. There are two security subcommands: |
||
| 52 | Scratchpad | |
| Technical review completed. | ||
| 53 | Writing GCLI Commands | |
| The documentation that comes with GCLI has a section on writing commands. The documentation that follows describes the GCLI support provided in Firefox. | ||
| 54 | Editor | |
| The Editor is a code-editor component that can be embedded in your addons. All existing Firefox Developer Tools currently use this component. Under the hood, the Editor component is a thin wrapper around the CodeMirror open source editor. | ||
| 55 | Example add-ons | |
| Use these examples to understand how to implement a DevTools add-on. | ||
| 56 | Eyedropper | |
| The Eyedropper tool enables you to select colors in the current page. It works like a magnifying glass over the page, enabling you to select with pixel precision. Underneath the magnifying glass it shows the color value for the current pixel using whichever scheme you've selected in Settings > Inspector > Default color unit: | ||
| 57 | Firefox OS 1.1 Simulator | Firefox OS, Guide, Tools |
| The Firefox OS Simulator add-on is a tool that enables you to test and debug your Firefox OS app on the desktop. The code-test-debug cycle is much faster with the simulator than with a real device, and of course, you don't need a real device in order to use it. | ||
| 58 | Firefox OS Simulator | |
| The Firefox OS Simulator is a version of the higher layers of Firefox OS that simulates a Firefox OS device, but runs on the desktop. This means that in many cases, you don't need a real device to test and debug your app. It runs in a window the same size as a Firefox OS device, includes the Firefox OS user interface and built-in apps, and simulates many of the Firefox OS device APIs. | ||
| 59 | Index | Tools |
| Found 154 pages: | ||
| 60 | JSON viewer | |
| Starting in Firefox 44, the Developer Edition includes a JSON viewer. | ||
| 61 | Keyboard shortcuts | Tools, l10n:priority |
| This page lists all keyboard shortcuts used by the developer tools built into Firefox. | ||
| 62 | Memory | DevTools, Firefox, Mozilla, Tools |
| The Memory tool lets you take a snapshot of the current tab's memory heap. It then provides a number of views of the heap that can show you which objects account for memory usage and exactly where in your code you are allocating memory. | ||
| 63 | Aggregate view | |
| Before Firefox 48, this was the default view of a heap snapshot. After Firefox 48, the default view is the Tree map view, and you can switch to the Aggregate view using the dropdown labeled "View:": | ||
| 64 | Basic operations | |
| Before Firefox 50, the Memory tool is not enabled by default. To enable it, open the developer tool settings, and check the "Memory" box under "Default Firefox Developer Tools": | ||
| 65 | DOM allocation example | |
| This article describes a very simple web page that we'll use to illustrate some features of the Memory tool. | ||
| 66 | Dominators | |
| With a garbage-collected language, like JavaScript, the programmer doesn't generally have to worry about deallocating memory. They can just create and use objects, and when the objects are no longer needed, the runtime takes care of cleaning up, and frees the memory the objects occupied. | ||
| 67 | Dominators view | |
| Starting in Firefox 46, the Memory tool includes a new view called the Dominators view. This is useful for understanding the "retained size" of objects allocated by your site: that is, the size of the objects themselves plus the size of the objects that they keep alive through references. | ||
| 68 | Monster example | |
| This article describes a very simple web page that we'll use to illustrate some features of the Memory tool. | ||
| 69 | Tree map view | |
| The Tree map view provides a visual representation of the snapshot, that helps you quickly get an idea of which objects are using the most memory. | ||
| 70 | Network Monitor | Debugging, Dev Tools, Firefox, Guide, Networking, Tools, debugging, l10n:priority |
| The Network Monitor shows you all the network requests Firefox makes (for example, when it loads a page, or due to XMLHttpRequests), how long each request takes, and details of each request. | ||
| 71 | Page Inspector | CSS, DOM, HTML, Stylesheets, Tools, Web Development, Web Development:Tools, l10n:priority |
| Use the Page Inspector to examine and modify the HTML and CSS of a page. | ||
| 72 | How to | |
| Links for various HOW TO's can be found here. These links describe in depth the HOW TO techniques. | ||
| 73 | Edit CSS filters | CSS, DevTools, Filters, Page Inspector, Tools |
filter properties in the Rules view have a circular gray and white swatch next to them: |
||
| 74 | Examine and edit CSS | Guide, Inspector, Tools |
| You can examine and edit CSS in the Inspector's CSS pane. | ||
| 75 | Examine and edit HTML | Guide, Inspector, Tools |
| You can examine and edit the page's HTML in the HTML pane. | ||
| 76 | Examine and edit the box model | Guide, Tools |
| With the Select Element button pressed, if you hover over an element in the page, the box model for the element is shown overlaid on the page: | ||
| 77 | Examine event listeners | Guide, Inspector, Tools |
| From Firefox 33 you'll see an "ev" icon in the HTML Pane, next to elements that have event listeners bound to them: | ||
| 78 | Inspect and select colors | Guide, Inspector, Tools |
| In the CSS Pane's Rules view, if a rule contains a color value, you'll see a sample of the color next to the value: | ||
| 79 | Open the Inspector | Guide, Inspector, Tools |
| There are two main ways to open the Inspector: | ||
| 80 | Reposition elements in the page | |
| Starting in Firefox 48 you can move absolutely positioned elements by dragging them around the page. | ||
| 81 | Select an element | Guide, Inspector, Tools |
| If you opened the Inspector by clicking "Inspect Element", then an element will already be selected. | ||
| 82 | Use the Inspector API | Inspector, Reference, Référence, Tools |
| Firefox add-ons may access the following objects from the chrome://browser/content/devtools/inspector/inspector.xul context: | ||
| 83 | Use the Inspector from the Web Console | Guide, Inspector, Tools |
The element that's currently selected in the Page Inspector can be referenced in the Web Console using the variable $0. |
||
| 84 | View background images | |
| In the Rules view, you can see a preview of images specified using background-image. Just hover over the rule: | ||
| 85 | View fonts | Guide, Inspector, Tools |
If you hover over a font-family property in the Rules view, you will get a tooltip with a sample of that font: |
||
| 86 | Visualize transforms | Guide, Inspector, Tools |
If you hover over a transform property in the Rules view, you'll see the transformation overlaid in the page: |
||
| 87 | Work with animations | Guide, Inspector, Tools |
| This article covers three tools you can use to visualize and edit animations: | ||
| 88 | Animation inspector (Firefox 41 and 42) | |
| In Firefox 41 and 42, the Animation inspector enables you to: | ||
| 89 | Animation inspector example: CSS transitions | |
| Example animation using CSS transitions. | ||
| 90 | Animation inspector example: Web Animations API | |
| Example animation using the Web Animations API. | ||
| 91 | Keyboard shortcuts | |
| These shortcuts work while you're in the Inspector's HTML pane. | ||
| 92 | UI Tour | Guide, Inspector, Tools |
| This article is a quick tour of the main sections of the Page Inspector's user interface. | ||
| 93 | Paint Flashing Tool | |
| The paint flashing tool, when activated, highlights the part of a page that the browser needs to repaint in response to some input: for example, the user moving the mouse or scrolling. With the help of this tool you can figure out whether your website is causing the browser to repaint more than it needs to. Because repaints can be performance-intensive operations, eliminating unnecessary repaints can improve your website's responsiveness. | ||
| 94 | Performance | |
| The Performance tool gives you insight into your site's general responsiveness, JavaScript and layout performance. With the Performance tool you create a recording, or profile, of your site over a period of time. The tool then shows you an overview of the things the browser was doing to render your site over the profile, and a graph of the frame rate over the profile. | ||
| 95 | Allocations | |
| To enable the Allocations view, you must check "Record Allocations" in the Performance tool settings, before recording a profile. Then record a profile as usual, and you will see a new tab labeled "Allocations" in the toolbar: | ||
| 96 | Call Tree | JavaScript, Performance, memory, performance |
| The Call Tree is a sampling profiler. It periodically samples the state of the JavaScript engine and records the stack for the code executing at the time. Statistically, the number of samples taken in which we were executing a particular function corresponds to the amount of time the browser spent executing it. | ||
| 97 | Examples | |
| List of demo pages for performance scenarios and walkthroughs. | ||
| 98 | Sorting algorithms comparison | |
| This article describes a simple example program that we use in two of the Performance guides: the guide to the Call Tree and the guide to the Flame Chart. | ||
| 99 | Flame Chart | |
| The Call Tree and the Flame Chart are both used to analyze your site's JavaScript, and they both use the same data: a sample of the JavaScript engine's stack, taken periodically during the recording. | ||
| 100 | Frame rate | |
| Frame rate is the rate at which a video device can produce images (or frames). It's most familiar from film and gaming, but is now widely used as a performance measure for websites and web apps. | ||
| 101 | How to | |
| To open the Performance tools: | ||
| 102 | Scenarios | NeedsContent |
| Performance scenarios | ||
| 103 | Animating CSS properties | |
| With CSS animations you specify a number of keyframes, each of which uses CSS to define the appearance of the element at a particular stage of the animation. The browser creates the animation as a transition from each keyframe to the next. | ||
| 104 | Intensive JavaScript | |
| If you want to play along you can find the demo website here. | ||
| 105 | UI Tour | |
| The performance tool's UI consists of 4 main pieces: | ||
| 106 | Waterfall | |
 |
||
| 107 | Release notes | |
| All devtools bugs fixed between Firefox 50 and Firefox 51. | ||
| 108 | Remote Debugging | Tools, l10n:priority |
| You can use the Firefox developer tools on your desktop to debug Web sites and Web apps running in other browsers or runtimes. The other browser might be on the same device as the tools themselves or on a different device, such as a phone connected over USB. | ||
| 109 | Debugging Firefox Desktop | Debugging, Guide, Tools, debugging |
| This guide explains how you can use the Firefox Developer Tools to debug a different instance of desktop Firefox running on the same machine. In this guide, the instance of Firefox being debugged is called the debuggee, and the instance of Firefox doing the debugging is called the debugger. | ||
| 110 | Debugging Firefox OS over USB | |
| This guide explains how to connect the Firefox Developer Tools to a Firefox OS device over USB. | ||
| 111 | Debugging Firefox OS over WiFi | |
| This article describes how to connect the Firefox Developer Tools to a Firefox OS device over WiFi. | ||
| 112 | Debugging Firefox for Android over USB | remoteDebug |
| This article describes how to connect the Firefox Developer Tools to Firefox for Android from Firefox 36 onwards. For connecting over WiFi, see corresponding page. | ||
| 113 | Debugging Firefox for Android over WiFi | |
| Technical review completed. Editorial review completed. | ||
| 114 | Debugging Firefox for Android with WebIDE | Debugging, Guide, Tools |
| This article describes how to connect the Firefox Developer Tools to Firefox for Android from Firefox 36 onwards. | ||
| 115 | Remotely debugging Chrome Desktop | |
| How to connect the Firefox Developer Tools to the Google Chrome browser running on the desktop. | ||
| 116 | Remotely debugging Firefox <36 for Android | Android, Debugging, android, debugging |
| This guide explains how to use remote debugging to inspect or debug code running in Firefox for Android over USB. | ||
| 117 | Remotely debugging Firefox for Metro | |
| This article explains how to use remote debugging to inspect and code running in the new Windows 8 ("Metro-style") Firefox app, using the developer tools in Firefox on the desktop. | ||
| 118 | Remotely debugging Thunderbird | Debug, Tutorial, thunderbird |
| This guide explains how to use remote debugging to inspect or debug code running in Thunderbird. | ||
| 119 | Responsive Design Mode | Design, Dev Tools, Firefox, Guide, Responsive Design, Tools, Web Development, l10n:priority |
| Responsive designs adapt to different screen sizes to provide a presentation that is suitable for different kinds of devices, such as mobile phones or tablets. Responsive Design Mode makes it easy to see how your website or web app will look on different screen sizes. | ||
| 120 | Rulers | |
| New in Firefox 40. | ||
| 121 | Scratchpad | Scratchpad, Tools, Web Development, Web Development:Tools, l10n:priority |
| Scratchpad provides an environment for experimenting with JavaScript code. You can write, run, and examine the results of code that interacts with the web page. | ||
| 122 | Settings | |
| To see the Developer Tools Settings pane, open any of the Developer Tools, and then: | ||
| 123 | Shader Editor | |
| The Shader Editor enables you to see and edit the vertex and fragment shaders used by WebGL. | ||
| 124 | Storage Inspector | Cookies, Dev Tools, Firefox, Guide, IndexedDB, Local Storage, Session Storage, Storage, Tools, cookies, storage |
| The Storage Inspector enables you to inspect various types of storage that a web page can use. Currently it can be used to inspect the following storage types: | ||
| 125 | Style Editor | CSS, Stylesheets, Tools, Web Development, Web Development:Tools |
| The Style Editor enables you to: | ||
| 126 | The Web Developer Menu | Add-ons, Debugging, Tools, Web Developer |
| The Web Developer menu is the main way to access the developer tools that are built into Firefox. On OS X and Linux, it's under the "Tools" menu: | ||
| 127 | Tips | Dev Tools, Tools, Web Development |
| Screenshots: | ||
| 128 | Toolbox | |
| The Toolbox provides a single home for most of the developer tools that are built into Firefox. | ||
| 129 | Tools/Debugger.Object | |
A Debugger.Object instance represents an object in the debuggee, providing reflection-oriented methods to inspect and modify its referent. The referent's properties do not appear directly as properties of the Debugger.Object instance; the debugger can access them only through methods like Debugger.Object.prototype.getOwnPropertyDescriptor and Debugger.Object.prototype.defineProperty, ensuring that the debugger will not inadvertently invoke the referent's getters and setters. |
||
| 130 | Valence (Firefox Tools Adapter) | |
| Valence (formerly Firefox Tools Adapter) is an experimental add-on that enables the Firefox Developer Tools to debug a wider variety of browsers, not just the Gecko-based Firefox, Firefox for Android, and Firefox OS browsers. | ||
| 131 | Validators | Tools, Website validator, html5 validator, validator |
| This document lists different resources for developers to validate web pages. | ||
| 132 | View Source | |
| View Source lets you look at the HTML or XML source for the page you're viewing. To activate View Source: | ||
| 133 | Web Audio Editor | Tools |
With the Web Audio API, developers create an audio context. Within that context they then construct a number of audio nodes, including: |
||
| 134 | Web Console | Debugging, Guide, Security, Tools, Web Development, Web Development:Tools, debugging, l10n:priority, web console |
| The Web Console: | ||
| 135 | Console messages | |
| Most of the Web Console is occupied by the message display pane: | ||
| 136 | Custom output in the Web Console | Extensions, Guide, Reference, Référence, web console |
| This document describes how you can extend and customize the output of the Web Console and of the Browser Console. Here you can also learn how to extend the object previews we generate in the consoles and in the Object Inspector. | ||
| 137 | Keyboard shortcuts | |
| These shortcuts apply when you're in the command line interpreter. | ||
| 138 | Opening the Web Console | |
| To open the Web Console: | ||
| 139 | Rich output | |
| When the Web console prints objects, it includes a richer set of information than just the object's name. In particular, it: | ||
| 140 | Split console | |
| You can use the console alongside other tools. While you're in another tool in the Toolbox, just press Esc or press the "Toggle split console" button in the Toolbar. The toolbox will now appear split, with the original tool above and the web console underneath. | ||
| 141 | The command line interpreter | |
| You can interpret JavaScript expressions in real time using the command line provided by the Web Console. | ||
| 142 | Web Console Helpers | Debugging, Web Development, debugging, web console |
| The JavaScript command line provided by the Web Console offers a few built-in helper functions that make certain tasks easier. | ||
| 143 | Web Console remoting | Debugging, Reference, Référence, web console |
| This document describes the way Web Console remoting works. The Web Console is split between a client with its user interface, and the server which has listeners for all the things that happen in the tab. For communication between the server and the client we use the Remote Debugging Protocol. This architecture allows you to connect a Web Console client instance to a server running on B2G, Fennec or some other Firefox instance. | ||
| 144 | WebIDE | Apps, B2G, Debugging, Firefox OS, WebIDE, WebIde, debugging, tool |
| With WebIDE, you first set up one or more runtimes. A runtime is an environment in which you'll run and debug the app. A runtime could be a Firefox OS device connected to the desktop over USB (or over Wi-Fi since Firefox 39), or it could be a Firefox OS Simulator installed on the desktop itself. | ||
| 145 | Creating and editing apps | |
| The sidebar on the left-hand side of the WebIDE enables you to: | ||
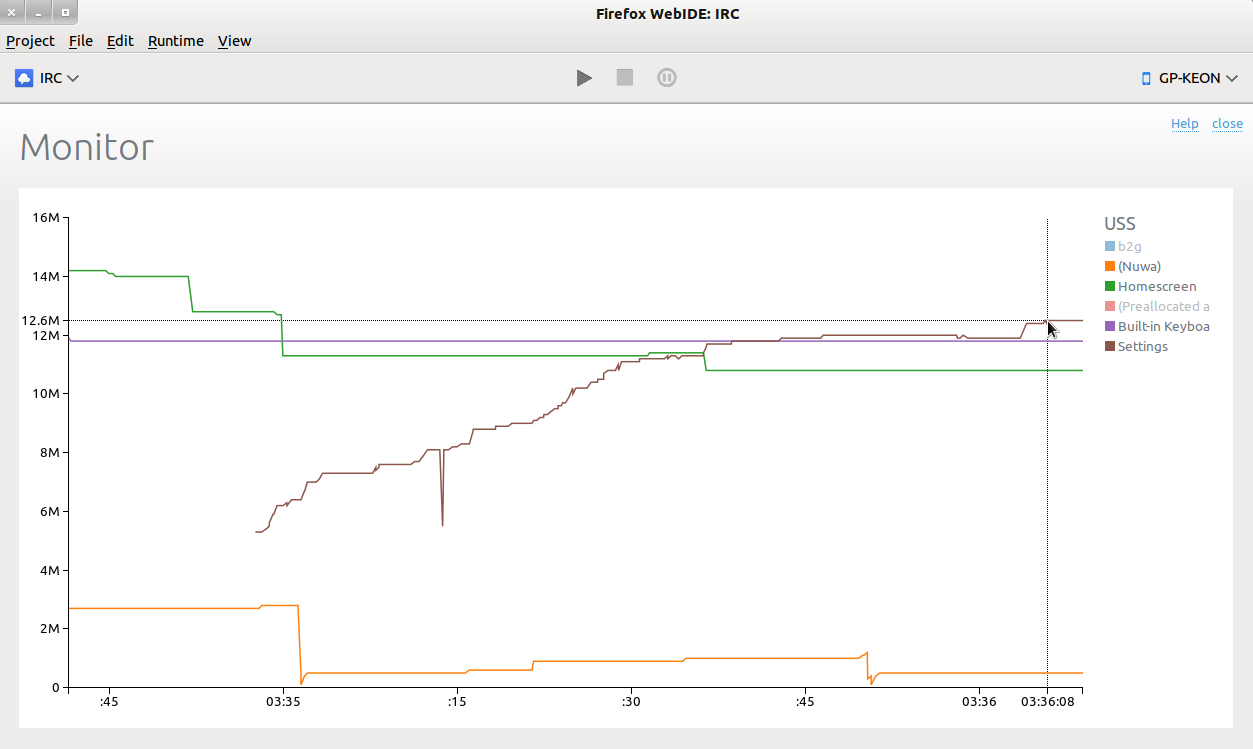
| 146 | Monitor | |
 |
||
| 147 | Opening WebIDE | WebIDE, WebIde, opening |
| There are three ways to open WebIDE: | ||
| 148 | Running and debugging apps | |
| When you're ready to run the app, you need to select a runtime from the Runtimes sidebar. If you don't have any available runtimes here, find out how to add some in Setting up runtimes. | ||
| 149 | Setting up runtimes | |
| A runtime is an environment in which you'll run and debug the app, such as a web browser. A runtime could be: | ||
| 150 | The runtime menu | |
| Once you've selected a runtime, you can access the runtime settings: | ||
| 151 | WebIDE Troubleshooting | |
| If you're trying to connect a Firefox OS device to WebIDE and it doesn't show up, here are some things you can try: | ||
| 152 | Working with Cordova apps in WebIDE | |
| Technical review completed. Editorial review completed. | ||
| 153 | Working with iframes | Debugging, DevTools, Developer Tools, Frames, Tools, debugging |
From Firefox 34 onwards, you can point the developer tools at a specific iframe within a document. |
||
| 154 | about:debugging | |
| The about:debugging page provides a single place from which you can attach the Firefox Developer Tools to a number of debugging targets. At the moment it supports two main sorts of targets: restartless add-ons and workers. | ||