Перевод не завершен. Пожалуйста, помогите перевести эту статью с английского.
Элемент <path> – наиболее мощный элемент в библиотеке основных форм SVG. Его можно использовать для создания всех других основных форм и другого.
Пути создают сложные формы, объединяющие многочисленные прямые и кривые линии. Сложные формы, образованные только прямыми линиями могут быть созданы как polylines. Хотя элементы polyline и paths могут создавать формы, выглядящие одинаково, polyline необходимо много маленьких прямых линий для отображения кривых, и этот элемент не очень хорошо масштабируется до больших размеров. Хорошее понимание paths важно при рисовании SVG. При создании сложных paths не рекомендуется использовать XML или текстовые редакторы – понимание, как они работают, позволит понять и исправить проблемы с отображением SVG.
Форма элемента path определяется одним атрибутом: d (смотри подробности в основные формы). Атрибут d содержит серию команд и параметров, используемых этими командами. Мы опишем доступные команды и покажем примеры того, что они делают.
Каждая команда обозначается специальной буквой. Давайте переместимся в точку (10,10) – x и y координаты соответственно. Команда "Передвинуть к" обозначается буквой M. Когда синтаксический анализатор наталкивается на эту команду, он знает, что необходимо переместиться к указанной точке. Поэтому для перемещения к точке (10,10) следует использовать команду "M 10 10". После этого, синтаксический анализатор начинает читать следующую команду.
Все команды существуют в двух вариантах: команда с заглавной буквы обозначает абсолютные координаты на странице, а команда с буквой нижнего регистра обозначает относительные координаты (например, передвижение от последней точки на 10px вверх и 7px влево).
Координаты в атрибуте d всегда пишутся без указания единиц измерения и находятся в системе пользовательских координат (обычно это пиксели). Позже мы узнаем, как элемент paths может быть трансформирован для удовлетворения других нужд.
Команды линии
Существуют пять команд линии для узлов <path>. Как следует из имени каждая просто рисует прямую линию между двумя точками. Первая команда это "Передвинуть к", M, которая описана выше. Опять же, она использует два параметра, координату x и координату y для передвижения. Если твой курсор уже был где-либо на странице, линия не рисуется для соединения двух мест. Команда "Передвинуть к" появляется в начале путей для определения, где рисование следует начать.
M x y
или
m dx dy
Хорошо рисовать примеры по мере того, как мы продвигаемся вперёд. К сожалению, мы еще ничего не нарисовали. Всё что мы сделали это движение начальной точки нашего пути, поэтому мы ничего не видим. Я собираюсь рисовать каждую из точек по мере того, как мы подходим к ним, поэтому в следующем примере у нас есть только точка (10,10). Хотя, необходимо отметить, что она не была бы чётко видна, если ты бы ты просто рисовал путь нормальным способом.
![]()
<svg width="200" height="200" xmlns="https://www.w3.org/2000/svg">

  <path d="M10 10"/>

  <!-- Точки -->
  <circle cx="10" cy="10" r="2" fill="red"/>

</svg>
Существуют три команды, которые рисуют линии. Наиболее обычная это команда "линия к" L. Эта команда использует два параметра - координаты x и y - и рисует линию от текущего положения к новому положению.
L x y (или l dx dy)
Существуют две укороченные формы для рисования горизонтальных и вертикальных линий. H рисует горизонтальную линию, а V рисует вертикальную линию. Обе команды используют только один аргумент, так как они движутся только в одном направлении.
 H x (или h dx)
 V y (или v dy)
Поэтому теперь мы знаем достаточно команд, чтобы начать что-либо рисовать. Простое место для начала - это просто рисунок плоского прямоугольника (фигуру подобного типа можно нарисовать более легким способом с использованием элемента <rect>). Он состоит только из горизонтальных и вертикальных линий:

<svg width="100" height="100" xmlns="https://www.w3.org/2000/svg">

  <path d="M10 10 H 90 V 90 H 10 L 10 10"/>

  <!-- Точки -->
  <circle cx="10" cy="10" r="2" fill="red"/>
  <circle cx="90" cy="90" r="2" fill="red"/>
  <circle cx="90" cy="10" r="2" fill="red"/>
  <circle cx="10" cy="90" r="2" fill="red"/>

</svg>
Наконец, мы можем немного укоротить вышеуказанную запись элемента path использованием команды "Закрыть путь", Z. Эта команда рисует прямую линию от текущего положения назад до первой точки, от которой начинался путь. Она часто помещается в конце узла пути, хотя нет необходимости закрывать путь все время. Очевидно не существует разницы между использованием верхнего и нижнего регистра буквы команды.
Z (или z)
Поэтому наш путь, указанный выше, мог бы быть сокращен до:
<path d="M10 10 H 90 V 90 H 10 Z" fill="transparent" stroke="black"/>
Можно также использовать относительную форму этих команд, чтобы нарисовать такую же картинку. Как было отмечено ранее, относительные команды вызываются использованием букв нижнего регистра, и скорее чем двигая курсор к определенной координате, они двигают его относительно его последнего положения. Например, поскольку 80 x 80, элемент путь мог бы быть записан:
<path d="M10 10 h 80 v 80 h -80 Z" fill="transparent" stroke="black"/>
Путь будет двигаться к точке (10,10) и затем двигаться горизонтально 80 точек вправо, затем 80 точек вниз, затем 80 точек влево, и затем назад к старту.
Может возникнуть вопрос, зачем использовать эти команды. когда элементы <polygon> или <polyline> могут делать такие же вещи. Ответ в том, что они не делают ничего более. Если ты только рисуешь прямые линии, проще использовать одну из других форм, особенно при рисовании в программе. Однако, пути используются так часто при рисовании SVG, что разработчики привыкли к ним, и ты будешь видеть их вместо других возможных команд. Никакого предпочтения в использовании одной или другой команды нет.
Curve commands
There are three different commands that you can use to create smooth curves. Two of those curves are Bezier curves, and the third is an "arc" or part of a circle. You might have already gained practical experience with Bezier curves using path tools in Inkscape, Illustrator or Photoshop. For a complete description of the math behind Bezier curves, go to a reference like the one on Wikipedia. It's too much information to try and cover here. There are an infinite number of different types of Bezier curves, but only two simple ones are available in path elements: a cubic one, C, and a quadratic one, Q.
Bezier Curves
So we'll start with the slightly more complex Bezier curve: the cubic one, C. Cubic Beziers take in two control points for each point. Thus to create a cubic Bezier, you need to specify three sets of coordinates.
C x1 y1, x2 y2, x y (or c dx1 dy1, dx2 dy2, dx dy)
The last set of coordinates here (x,y) are where you want the line to end. The other two are control points. (x1,y1) is the control point for the start of your curve, and (x2,y2) for the end point of your curve. If you are familiar with algebra or calculus, the control points essentially describe the slope of your line starting at each point. The Bezier function then creates a smooth curve that transfers you from the slope you established at the beginning of your line, to the slope at the other end.

<svg width="190" height="160" xmlns="https://www.w3.org/2000/svg">

  <path d="M10 10 C 20 20, 40 20, 50 10" stroke="black" fill="transparent"/>
  <path d="M70 10 C 70 20, 120 20, 120 10" stroke="black" fill="transparent"/>
  <path d="M130 10 C 120 20, 180 20, 170 10" stroke="black" fill="transparent"/>
  <path d="M10 60 C 20 80, 40 80, 50 60" stroke="black" fill="transparent"/>
  <path d="M70 60 C 70 80, 110 80, 110 60" stroke="black" fill="transparent"/>
  <path d="M130 60 C 120 80, 180 80, 170 60" stroke="black" fill="transparent"/>
  <path d="M10 110 C 20 140, 40 140, 50 110" stroke="black" fill="transparent"/>
  <path d="M70 110 C 70 140, 110 140, 110 110" stroke="black" fill="transparent"/>
  <path d="M130 110 C 120 140, 180 140, 170 110" stroke="black" fill="transparent"/>

</svg>
The example above creates nine Cubic Bezier curves. As the curves move toward the left, the control points become more spread out horizontally. As it moves towards the right, they become further separated from the end points. The thing to note here is that the curve starts out in the direction of the first control point, and then bends so that it arrives along the direction of the second control point.
You can string together several Bezier curves to create extended, smooth shapes. Often, in this case, the control point on one side of a point will be a reflection of the control point used on the other side (to keep the slope constant). In this case, you can use a shortcut version of the cubic Bezier, designated by the command S (or s).
S x2 y2, x y (or s dx2 dy2, dx dy)
S produces the same type of curve as earlier, but if it follows another S command or a C command, the first control point is assumed to be a reflection of the one used previously. If the S command doesn't follow another S or C command, then it is assumed that both control points for the curve are the same. An example of this syntax is shown below, and in the figure to the left the specified control points are shown in red, and the inferred control point in blue.

<svg width="190" height="160" xmlns="https://www.w3.org/2000/svg">
  <path d="M10 80 C 40 10, 65 10, 95 80 S 150 150, 180 80" stroke="black" fill="transparent"/>
</svg>
The other type of Bezier curve that is available is a quadratic Bezier, Q. It's actually a simpler curve than the cubic one: it requires one control point only, which determines the slope of the curve at both the start point and the end point. It takes two arguments: the control point and the end point of the curve.
Q x1 y1, x y (or q dx1 dy1, dx dy)

<svg width="190" height="160" xmlns="https://www.w3.org/2000/svg">
  <path d="M10 80 Q 95 10 180 80" stroke="black" fill="transparent"/>
</svg>
As with the cubic Bezier curve, there is a shortcut for stringing together multiple quadratic Beziers, T.
T x y (or t dx dy)
As before, the shortcut looks at the previous control point you used and infers a new one from it. This means that after your first control point, you can make fairly complex shapes by specifying only end points. Note that this only works if the previous command was a Q or a T command. If it is not, then the control point is assumed to be the same as the previous point, and you'll only draw lines.

<svg width="190" height="160" xmlns="https://www.w3.org/2000/svg">
  <path d="M10 80 Q 52.5 10, 95 80 T 180 80" stroke="black" fill="transparent"/>
</svg>
Both curves produce fairly similar results, although the cubic allows you greater freedom in exactly what your curve looks like. Deciding which curve to use often just depends on the situation and the amount of symmetry your line has.
Arcs
The other type of curved line you can create using SVG is the arc, A. Arcs are sections of circles or ellipses. For a given x-radius and y-radius, there are two ellipses that can connect any two points (as long as they're within the radius of the circle). Along either of those circles there are two possible paths that you can take to connect the points, so in any situation there are four possible arcs available. Because of that, arcs have to take in quite a few arguments:
 A rx ry x-axis-rotation large-arc-flag sweep-flag x y
 a rx ry x-axis-rotation large-arc-flag sweep-flag dx dy
At its start the arc element takes in two arguments for the x-radius and y-radius. If you need to, look up ellipses to see how they behave. The third parameter describes the rotation of the arc. This is best explained with an example:

<svg width="320" height="320" xmlns="https://www.w3.org/2000/svg">
  <path d="M10 315
           L 110 215
           A 30 50 0 0 1 162.55 162.45
           L 172.55 152.45
           A 30 50 -45 0 1 215.1 109.9
           L 315 10" stroke="black" fill="green" stroke-width="2" fill-opacity="0.5"/>
</svg>
The example shows a path element that goes diagonally across the page. At its center, two elliptical arcs have been cut out (x radius = 30, y radius = 50). In the first one, the x-axis-rotation has been left at 0, so the ellipse that the arc travels around (shown in gray) is oriented straight up and down. For the second arc, though, the x-axis-rotation is set to -45 degrees. This rotates the ellipse so that it is aligned with its minor axis along the path direction, as shown by the second ellipse in the example image.
The four different paths mentioned above are determined by the next two argument flags. As mentioned earlier, there are still two possible ellipses for the path to travel around and two different possible paths on both ellipses, giving four possible paths. The first argument is the large-arc-flag. It simply determines if the arc should be greater than or less than 180 degrees; in the end, this flag determines which direction the arc will travel around a given circle. The second argument is the sweep-flag. It determines if the arc should begin moving at negative angles or positive ones, which essentially picks which of the two circles you will travel around. The example below shows all four possible combinations, along with the two circles for each case.
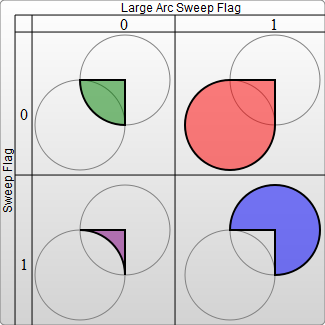
<svg width="325" height="325" xmlns="https://www.w3.org/2000/svg">
  <path d="M80 80
           A 45 45, 0, 0, 0, 125 125
           L 125 80 Z" fill="green"/>
  <path d="M230 80
           A 45 45, 0, 1, 0, 275 125
           L 275 80 Z" fill="red"/>
  <path d="M80 230
           A 45 45, 0, 0, 1, 125 275
           L 125 230 Z" fill="purple"/>
  <path d="M230 230
           A 45 45, 0, 1, 1, 275 275
           L 275 230 Z" fill="blue"/>
</svg>
The final two arguments, if you haven't guessed yet, designate the x and y coordinates to end the stroke at. Arcs are an easy way to create pieces of circles or ellipses in your drawings. For instance, a pie chart would require a different arc for each piece.
If you're transitioning to SVG from Canvas, arcs can be the hardest thing to move, but are also much more powerful. Complete circles and ellipses are actually the one shape that canvas paths have trouble drawing. Because the start and end points for any path going around a circle are the same, there are an infinite number of circles that could be chosen, and the actual path is undefined. It's possible to approximate them by making the start and end points of your path slightly askew, and then connecting them with another path segment. At that point, it's often easier to use a real circle or ellipse node instead.