Beginning with Firefox 4, the old Error Console has been deprecated in favor of the new, improved Web Console. The Web Console is something of a heads-up display for the web, letting you view error messages and other logged information. In addition, there are methods you can call to output information to the console, making it a useful debugging aid, and you can evaluate JavaScript on the fly.
The Web Console won't replace more advanced debugging tools like Firebug; what it does give you, however, is a way to let remote users of your site or web application gather and report console logs and other information to you. It also provides a lightweight way to debug content if you don't happen to have Firebug installed when something goes wrong.
devtools.errorconsole.enabled preference to true and restarting the browser.Opening the Web Console
Opening the Web Console is as simple as selecting the "Web Console" option from the Web Developer submenu in the Firefox Menu (or Tools menu if you display the menu bar or are on Mac OS X), or by pressing its Control-Shift-K (Command-Option-K on the Mac) keyboard shortcut. The Web Console will drop down from the top of the screen, shifting the web content down to make room.
On Windows, the menu option for the Web Console is in Firefox->Web Developer->Web Console.
Using the Web Console
The Web Console's interface consists of four areas: the toolbar, the log, the command line, and the resize bar.
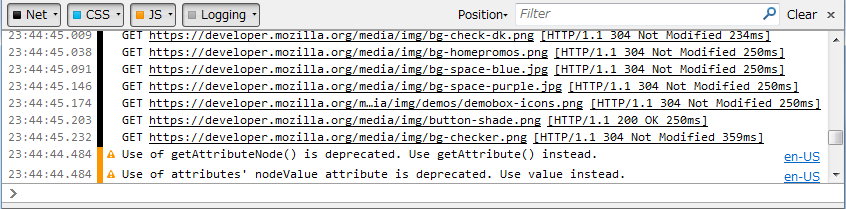
There are four types of messages that can be displayed in the log:
- Network messages
- These messages are generated by the browser to tell you about network requests. If you click on a network request, you can get a look at the headers and other information about the request, including the response. If you'd like to actually log the entire request and response, including the data, right-click on the log and choose the "Log Request and Response Bodies" option from the contextual menu that appears. See Network message window for a look at what the output looks like.
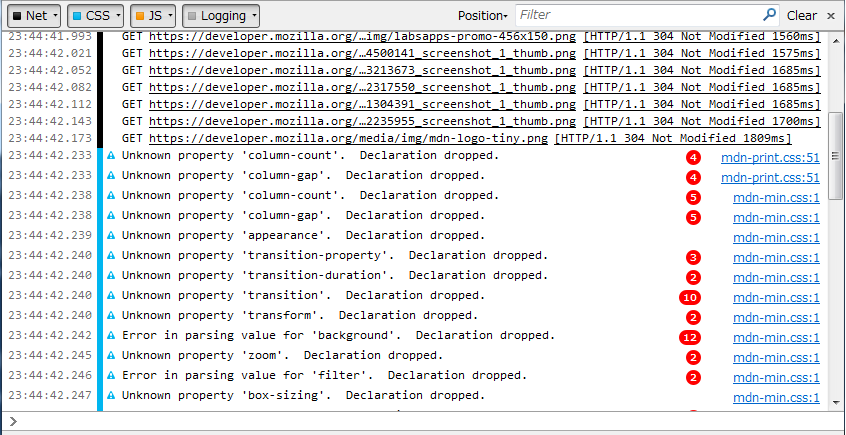
- CSS messages
- These messages are generated by the browser to inform you of CSS errors that occur while rendering content.
- JavaScript messages
-
These messages are used by the browser to tell you about JavaScript errors, such as syntax errors, that occur while interpreting JavaScript code. For a list of JavaScript errors and messages that can be output to the console, see the documentation for
nsIScriptError. - Logging messages
-
These messages are output explicitly by JavaScript code by using methods on the
consoleobject provided by the browser.
When the same message is output multiple times, the Web Console only lists it once, with a counter to the right showing how many times it was repeated. This saves space in the log so you can get a better look at what's happening.
Display of each of these types of messages can be toggled on and off by clicking the corresponding button in the Web Console's toolbar. You can further filter the display by entering text in the "Filter" edit box. To clear the contents of the log display, click the "Clear" button.
You can move the Web Console between the top and bottom of the window, or to a dedicated window, using the "Position" pop-up menu in the toolbar.
Below the toolbar is the log itself, and below that is the command line, where you can execute JavaScript in real time. A grippable resize bar is below that (or above it, if the Web Console is at the bottom of the window rather than the top.
Network message window
Let's take a look at what a network request information window looks like.
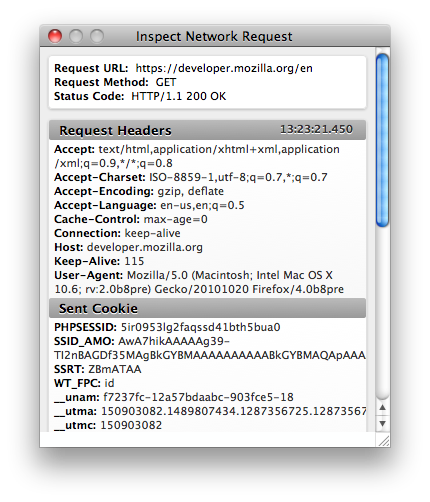
Scrolling this down provides the response headers. If you've enabled output of the request and response bodies, those are presented in this window as well.
The time listed after the HTTP status in the network message window is the time needed for the transfer of the complete response; that is, for both the header and body.
The command line interpreter
You can interpret JavaScript expressions in real time using the command line provided by the Web Console. See the little box with the ">" prompt in it? That's the command line.

Any JavaScript expression you type will be evaluated, and the result output into the console log. You can do anything from simple computations to evaluating complex expressions that can even include variables defined on the current page.
You can also use the up and down arrow keys to cycle through the history of the commands you've entered, and autocomplete options are provided.
Basic usage
You can use the command line interpreter as a simple calculator. You probably won't, but you can:

For convenience, the Web Console will try to autocomplete variable and function names it knows about. If it guesses wrong, you can either keep typing (and it will update its guess), or you can hit tab to get the next possible match.

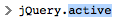
You can directly access variables defined on the page:
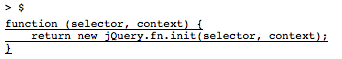
Here we see that jQuery is in use by the page we're looking at. Note what happens if we type "jQuery." then hit tab:
If we keep hitting tab, we get successive hints as to what we might be looking for.
this is not the window object as it would be in code running in content. This lets you create variables without contaminating the content's namespace.Keyboard shortcuts
| Shortcut | Description |
| ↑ | Moves to the previous entry in the command history, or, if an autocomplete popup is open, highlights the previous suggestion. |
| ↓ | Moves to the next entry in the command history, or, if an autocomplete popup is open, highlights the next suggestion. |
| Ctrl-A | Moves the cursor to the beginning of the line. |
| Ctrl-E | Moves the cursor to the end of the line. |
| Return | Executes the code typed on the command line, or, if an autocomplete popup is open, chooses the current suggestion. |
| Shift-Return | Expands the height of the text input box for the command line by a line. |
| Escape | Cancels the autocompletion popup. |
| Tab | Generates an autocomplete suggestion and accepts the first one. |
Helper commands
The JavaScript command line provided by the Web Console offers a few built-in helper functions that make certain tasks easier.
-
$() -
Looks up a CSS selector string, returning the first element that matches. Equivalent to
document.querySelector()or calls the $ function in the page, if it exists. -
$$() -
Looks up a CSS selector string, returning a list of DOM nodes that match. This is a shortcut for
document.querySelectorAll(). -
$0 - The currently-inspected element in the page.
-
$x() - Evaluates an XPath expression and returns an array of matching nodes.
-
keys() -
Given an object, returns a list of the keys (or property names) on that object. This is a shortcut for
Object.keys. -
values() -
Given an object, returns a list of the values on that object; serves as a companion to
keys(). -
clear() - Clears the console output area.
-
inspect() - Given an object, opens the object inspector for that object.
-
pprint() - Formats the specified value in a readable way; this is useful for dumping the contents of objects and arrays.
-
help() - Displays help text. Actually, in a delightful example of recursion, it will bring you to this page.
-
cd() - Switch JavaScript evaluation context to a different iframe in the page. See working with iframes.
- Please refer to the Console API for more information about logging from content.
Manipulating the page
You can actually make changes to the values of variables on the page to test things out. Just add "window." to the beginning of the variable name to make it visible to the page. For example, if the code on the page defines a variable counter, you can change it with:
window.counter = newvalue
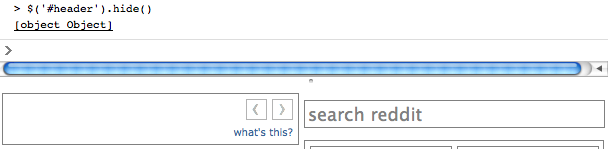
You can even call functions defined by the page. For example, consider the Reddit home page, where we know that there's a header on the page whose ID is "header". We can hide it by calling jQuery's hide() method:
Inspecting objects
Starting in Gecko 10.0 (Firefox 10.0 / Thunderbird 10.0 / SeaMonkey 2.7), the variable $0 can be used to reference the currently-selected element when the Page Inspector is open.
Any time an object is output, you see it in the log as [object objectName]. If you click on this, you get the object inspector. So in the above example, if you click on [object Object], you see this window:
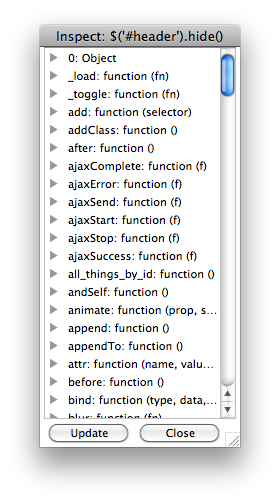
This shows you the state of the object at the moment you clicked to open the inspector. Click the Update button to refresh the display to show the current contents of the object.