If a user has opted into submitting performance data to Mozilla, the Telemetry system will collect various measures of Firefox performance, hardware, usage and customizations and submit it to Mozilla. The Telemetry data collected by a single client can be examined from the integrated about:telemetry browser page, while the aggregated reports across entire user populations are publicly available at https://telemetry.mozilla.org.
Note: Every new data collection in Firefox now needs a data collection review from a data collection peer. Just set the feedback? flag for :bsmedberg. We try to reply within a business day.
The following sections explain how to add a new measurement to Telemetry.
Telemetry Histograms
Telemetry histograms are the preferred way to track numeric measurements such as timings. Telemetry also tracks more complex data types such as slow SQL statement strings, browser hang stacks and system configurations. Most of these non-histogram measurements are maintained by the Telemetry team, so they are not covered in this document. If you need to add a non-histogram measurement, contact that team first.
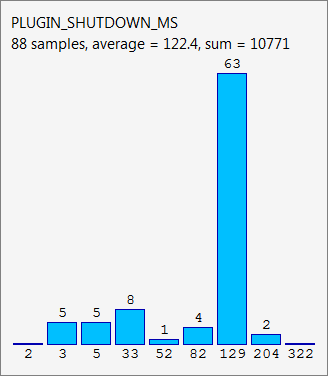
The histogram below is taken from Firefox's about:telemetry page. It shows a histogram used for tracking plugin shutdown times and the data collected over a single Firefox session. The timing data is grouped into buckets where the height of the blue bars represents the number of items in each bucket. The tallest bar, for example, indicates that there were 63 plugin shutdowns lasting between 129ms and 204ms.
Choosing a Histogram Type
The first step to adding a new histogram is to choose the histogram type that best represents the data being measured. The sample histogram used above is an "exponential" histogram.
Ony flag and count histograms have default values. All other histograms start out empty and are not submitted if no value is recorded for them.
The following types are available:
- flag: This histogram type allows you to record a single value (
0or1, default0). This type is useful if you need to track whether a feature was ever used during a Firefox session. You only need to add a single line of code which sets the flag when the feature is used because the histogram is initialized with a default value of0/false(flag not set). Thus, recording a value of0is not allowed and asserts. - boolean: These histograms only record boolean values. Multiple boolean entries can be recorded in the same histogram during a single browsing session, e.g. if a histogram is measuring user choices in a dialog box with options "Yes" or "No", a new boolean value is added every time the dialog is displayed.
- count: This histogram type is used when you want to record a count of something. It only stores a single value and defaults to
0.Count histograms and keyed histograms are fully supported only in our V4 pipeline tools, such as the unified telemetry (v4) dashboards. These are not fully supported in Telemetry v2 pipeline tools such as the histogram change detector.
- enumerated: This histogram type is intended for storing "enum" values. An enumerated histogram consists of a fixed number of "buckets", each of which is associated with a consecutive integer value (the bucket's "label"). Each bucket corresponds to an enum value and counts the number of times its particular enum value was recorded. You might use this type of histogram if, for example, you wanted to track the relative popularity of SSL handshake types. Whenever the browser started an SSL handshake, it would record one of a limited number of enum values which uniquely identifies the handshake type.
Set "n_buckets" to a slightly larger value than needed to allow for new enum values in the future. The current Telemetry server does not support changing histogram declarations after the histogram has already been released. See Miscellaneous section.
- linear: Linear histograms are similar to enumerated histograms, except each bucket is associated with a range of values instead of a single enum value. The range of values covered by each bucket increases linearly from the previous bucket, e.g. one bucket might count the number of occurrences of values between 0 to 9, the next bucket would cover values 10-19, the next 20-29, etc. This bucket type is useful if there aren't orders of magnitude differences between the minimum and maximum values stored in the histogram, e.g. if the values you are storing are percentages 0-100%.
If you need a linear histogram with buckets < 0, 1, 2 ... N >, then you should declare an enumerated histogram. This restriction was added to prevent developers from making a common off-by-one mistake when specifying the number of buckets in a linear histogram.
- categorical: Categorical histograms are similar to enumerated histograms. However, instead of specifying
n_buckets, you specify an array of strings in thelabelsfield. From JavaScript, the label values or their indices can be passed as strings tohistogram.add(). From C++ you can useAccumulateCategorical()with passing a value from the correspondingTelemetry::LABEL_*enum, or, in exceptional cases the string values.If you need to add new labels, you should use a new histogram name. The current Telemetry server does not support changing histogram declarations after the histogram has already been released. See Miscellaneous section.
-
exponential: Exponential histograms are similar to linear histograms but the range of values covered by each bucket increases exponentially. As an example of its use, consider the timings of an I/O operation whose duration might normally fall in the range of 0ms-50ms but extreme cases might have durations in seconds or minutes. For such measurements, you would want finer-grained bucketing in the normal range but coarser-grained bucketing for the extremely large values. An exponential histogram fits this requirement since it has "narrow" buckets near the minimum value and significantly "wider" buckets near the maximum value.
Keyed Histograms
Keyed histograms are collections of one of the histogram types above, indexed by a string key. This is for example useful when you want to break down certain counts by a name, like how often searches happen with which search engine.
Count histograms and keyed histograms are fully supported only in our V4 pipeline tools, such as the unified telemetry (v4) dashboards. These are not fully supported in Telemetry v2 pipeline tools such as the histogram change detector.
Declaring a Histogram
Histograms should be declared in the toolkit/components/telemetry/Histograms.json file. These declarations are checked for correctness at compile time and used to generate C++ code. It is also possible to create histograms at runtime dynamically, but this is primarily done by add-ons when they create their own histograms in Telemetry.
The following is a sample histogram declaration from Histograms.json for a histogram named MEMORY_RESIDENT which tracks the amount of resident memory used by a process:
"MEMORY_RESIDENT": {
  "alert_emails": ["[email protected]"],
  "expires_in_version": "never",
  "kind": "exponential",
  "low": "32 * 1024",
  "high": "1024 * 1024",
  "n_buckets": 50,
  "bug_numbers": [12345],
  "description": "Resident memory size (KB)"
},
Note that histogram declarations in Histograms.json are converted to C++ code so the right-hand sides of fields can be the names of C++ constants or simple expressions as in the "low" and "high" fields above.
The possible fields in a histogram declaration are:
- alert_emails: Required for all new histograms. This field is a list of e-mail addresses that should be notified when the distribution of the histogram changes significantly from one build-id to the other. This can be useful to detect regressions. Note that all alerts will be sent automatically to mozilla.dev.telemetry-alerts.
- expires_in_version: Required. The version number in which the histogram expires, e.g.
"30"; a version number of type"N"and"N.0"is automatically converted to"N.0a1"in order to expire the histogram also in the development channels. A telemetry probe acting on an expired histogram will be considered a non-op. For histograms that never expire the value"never"can be used as in the example above.Please do not use
"default". A value of"default"is effectively the same as"never", but means that expiration hasn't been set. - kind: Required. One of the histogram types described in the previous section. Different histogram types require different fields to be present in the declaration.
- keyed: Optional, boolean, defaults to
false. Determines whether this is a keyed histogram. - low: Optional, the default value is 0. This field represents the minimum value expected in the histogram. Note that all histograms automatically get a bucket with label "0" for counting values below the "low" value.
- high: Required for linear and exponential histograms. The maximum value to be stored in a linear or exponential histogram. Any recorded values greater than this maximum will be counted in the last bucket.
- n_buckets: Required for linear and exponential histograms. The number of buckets in a linear or exponential histogram.
- n_values: Required for enumerated histograms. Similar to n_buckets, it represent the number of elements in the enum.
- labels: Required for categorical histograms. This is an array of strings which are the labels for different values in this histograms. The labels are restricted to a C++-friendly subset of characters (
^[a-z][a-z0-9_]+[a-z0-9]$). - bug_numbers: Required for all new histograms. This is an array of integers and should at least contain the bug number that added the probe and additionally other bug numbers that affected its behavior.
- description: Required. A description of the data tracked by the histogram, e.g. "Resident memory size"
- cpp_guard: Optional. This field inserts an #ifdef directive around the histogram's C++ declaration. This is typically used for platform-specific histograms, e.g. "cpp_guard": "ANDROID"
- releaseChannelCollection: Optional. This is one of:
- "opt-in": (default value) This histogram is submitted by default on pre-release channels; on the release channel only if the user opted into additional data collection
- "opt-out": This histogram is submitted by default on release and pre-release channels, unless the user opted out.
Because they are collected by default, opt-out probes need to meet a higher "user benefit" threshold than opt-in probes.
Make sure you've NEEDINFO'd a privacy peer for ALL new data collection: https://wiki.mozilla.org/Firefox/Data_Collection
Adding a JavaScript Probe
A Telemetry probe is the code that measures and stores values in a histogram. Probes in privileged JavaScript code can make use of the nsITelemetry interface to get references to histogram objects. A new value is recorded in the histogram by calling add on the histogram object:
let histogram = Services.telemetry.getHistogramById("PLACES_AUTOCOMPLETE_1ST_RESULT_TIME_MS");
histogram.add(measuredDuration);

let keyed = Services.telemetry.getKeyedHistogramById("TAG_SEEN_COUNTS");
keyed.add("blink");
For histogram measuring time, TelemetryStopwatch can also be used to avoid working with Dates manually:
TelemetryStopwatch.start("SEARCH_SERVICE_INIT_MS");
TelemetryStopwatch.finish("SEARCH_SERVICE_INIT_MS");

TelemetryStopwatch.start("FX_TAB_SWITCH_TOTAL_MS");
TelemetryStopwatch.cancel("FX_TAB_SWITCH_TOTAL_MS");
Adding a C++ Probe
Probes in native code can also use the nsITelemetry interface, but the helper functions declared in Telemetry.h are more convenient:
#include "mozilla/Telemetry.h"

/**
 * Adds sample to a histogram defined in Histograms.json
 *
 * @param id - histogram id
 * @param sample - value to record.
 */
void Accumulate(ID id, uint32_t sample);

/**
 * Adds time delta in milliseconds to a histogram defined in Histograms.json
 *
 * @param id - histogram id
 * @param start - start time
 * @param end - end time
 */
void AccumulateTimeDelta(ID id, TimeStamp start, TimeStamp end = TimeStamp::Now());
The histogram names declared in Histograms.json are translated into constants in the mozilla::Telemetry namespace:
mozilla::Telemetry::Accumulate(mozilla::Telemetry::STARTUP_CRASH_DETECTED, true);
The Telemetry.h header also declares the helper classes AutoTimer and AutoCounter. Objects of these types automatically record a histogram value when they go out of scope:
nsresult
nsPluginHost::StopPluginInstance(nsNPAPIPluginInstance* aInstance)
{
  Telemetry::AutoTimer<Telemetry::PLUGIN_SHUTDOWN_MS> timer;
  ...
  return NS_OK;
}
Miscellaneous
- Changing histogram declarations after the histogram has been released is tricky. You will need to create a new histogram with the new parameters.
- For enum histograms, it's prudent to set "n_buckets" to a slightly larger value than needed since new elements may be added to the enum in the future.
getHistogramByIdwill throw an NS_ERROR_ILLEGAL_VALUE JavaScript exception if it is called with an invalid histogram ID- Flag histograms will ignore any changes after the flag is set, so once the flag is set, it cannot be unset
- Histograms which track timings in milliseconds or microseconds should suffix their names with "_MS" and "_US" respectively. Flag-type histograms should have the suffix "_FLAG" in their name.
- If a histogram does not specify a "low" value, it will always have a "0" bucket (for negative or zero values) and a "1" bucket (for values between 1 and the next bucket)
- The histograms on the about:telemetry page only show the non-empty buckets in a histogram except for the bucket to the left of the first non-empty bucket and the bucket to the right of the last non-empty bucket